Get in touch
contact@laverocktx.com
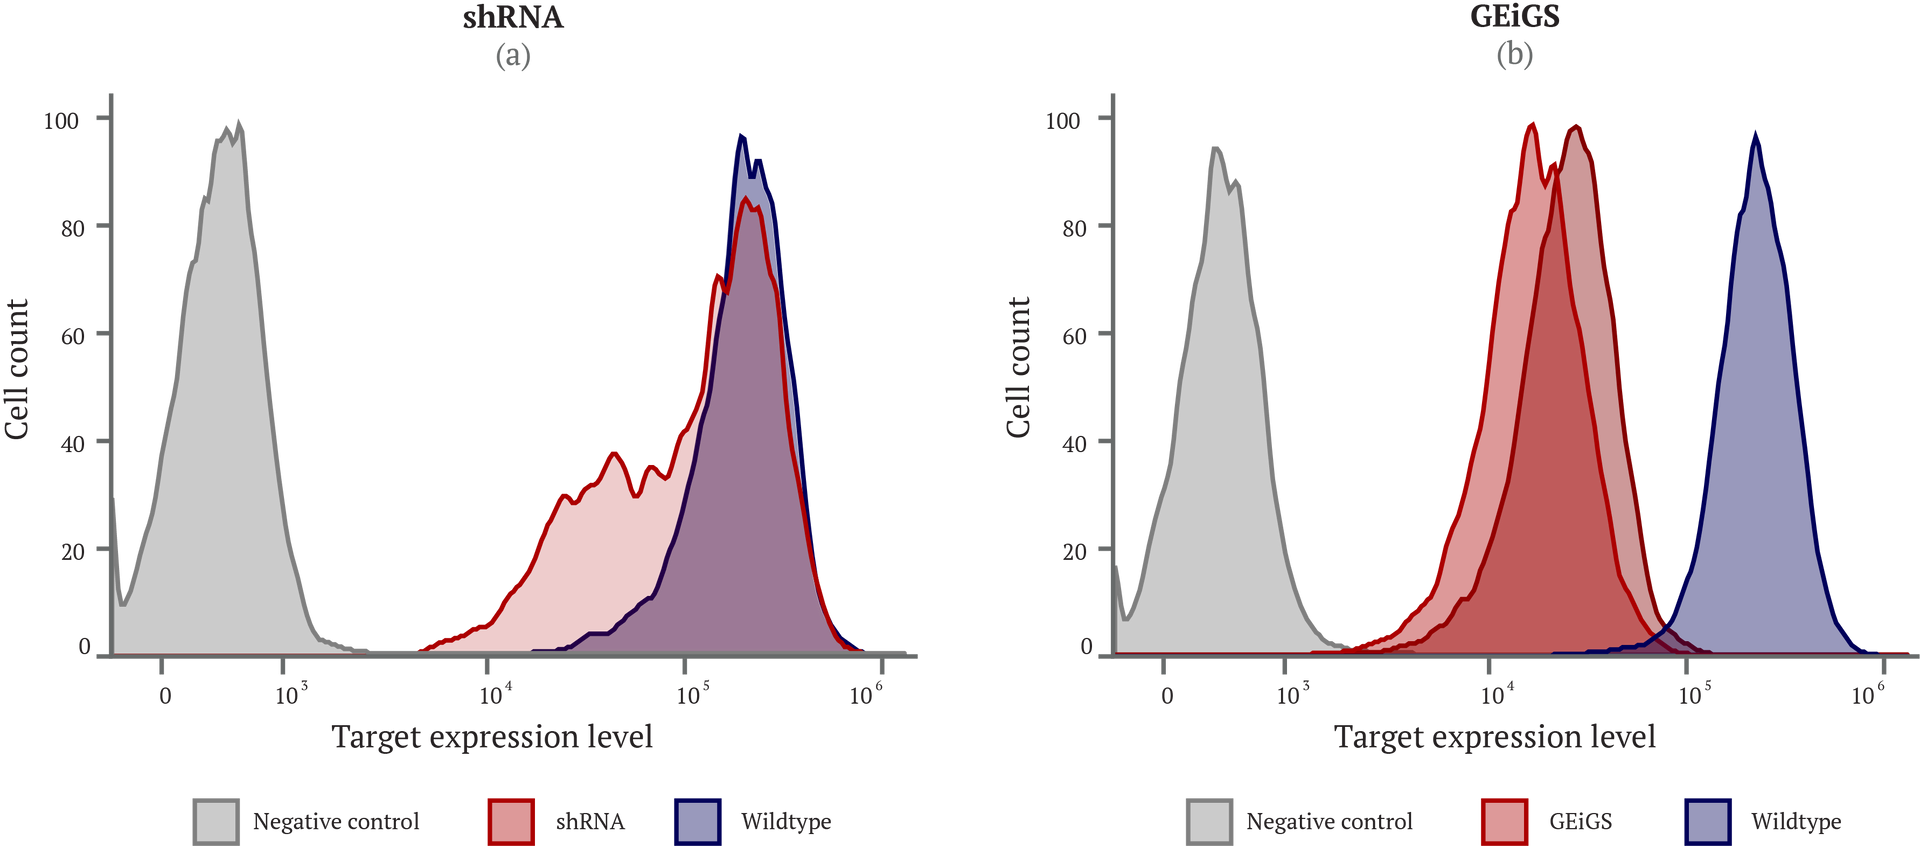
Flow cytometry analysis of target silencing efficiency in cells treated with shRNA (a) or GEiGS-engineered (b). Histograms show distribution of target expression level in the populations of treated cells (red) compared to untreated stained with isotype control (grey) and scrambled control-treated stained for the target (blue)
Speak to one of our team
To find out more about our technology and discuss partnering opportunities, please get in touch.